Read the Chart
Spans are already flowing into Tempo from the OpenFeature TracesHook, but the metrics half is dead: the MeterProvider has no exporter and the MetricsHook was never registered.
The dashboard the operator wants to triage from is empty. The k6 loadgen is idle, waiting for a flag flip to turn it on.
Mission Objective
- Spans for fun-with-flags-java-spring are visible in Tempo with feature_flag.context. attributes. Searching feature_flag.context.dose=underdose lights up requests where a subject was mis-dosed, with feature_flag.variant=clouded on the same span
- feature_flag_evaluation_requests_total is non-zero in Prometheus: flag evaluations show up as counters, not just spans
- The Feature Flag Metrics dashboard renders: variant distribution, error rate, and latency p99 are all populated from the metric counters
- The vision_amplifier_v2 rollout is rolled back to 100% off without redeploying the lab
- HTTP 5xx rate over the last minute drops below 1%: the bad arm is contained
Key Learnings
- How the OpenFeature OpenTelemetry hooks (TracesHook and MetricsHook) join flag evaluations to the rest of an application's telemetry without a separate ingestion path
- How to author your own Hook: a tiny class that copies merged-eval-context attributes onto the active OTelOpenTelemetry span, closing the loop between why a flag resolved the way it did and what the operator sees in Tempo
- How fractional rollout in flagd buckets users by targetingKey (same key, same bucket, every request) and how to read that bucketing off a dashboard
- How a flag flip is a faster operational lever than a redeploy when a rollout is misbehaving: the difference between a one-line config change and a twenty-minute deployment
Best Suited For
Platform engineers, SREsSite Reliability Engineers, and observability-focused developers who have completed the Beginner and Intermediate levels or are comfortable with OpenFeature evaluation context, and want to learn how flag evaluations join distributed traces and metrics, and how to use a flag flip as an operational lever for live rollbacks.
The Story
The trial just went wide. Phase 3 of the new vision amplifier (vision_amplifier_v2) was approved for the full cohort yesterday morning. The promise was straightforward: subjects emerge with sharper eyesight than they walked in with. By mid-afternoon the audit log was screaming. Subjects were stabilising 200ms slower, and roughly one in ten of them was emerging blind, with containment failure recorded as an HTTP 500. The lab director pulled up the Feature Flag Metrics dashboard expecting to triage visually. The dashboard was dark. Someone had wired up traces but never finished the metrics half. There is no chart to read. The lab is studying eyesight and the lab itself cannot see.
Your job, in order: turn on the lights, find the bad arm of the trial, and halt enrolment on the amplifier, all without redeploying the lab. That last constraint is the whole point of feature flags: when a rollout starts misbehaving in production, you need an operational lever that does not take twenty minutes to pull. Save the file, watch the dose drop, watch the 5xx rate fall back to baseline, watch the next batch of subjects walk out seeing.
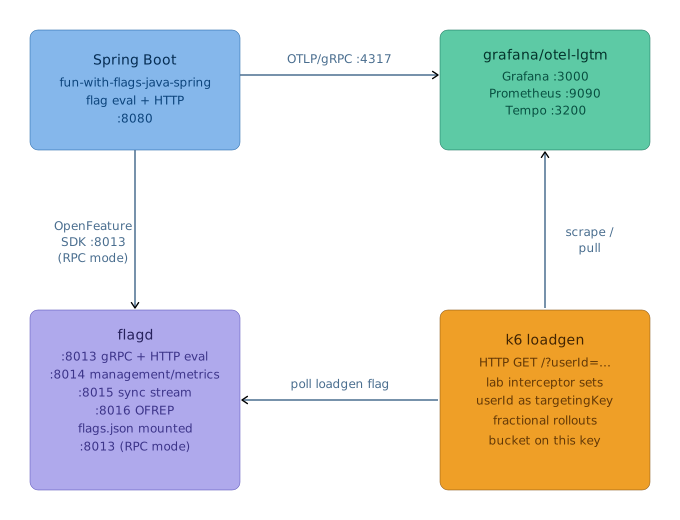
Architecture
Ready to start?
Launch in a preconfigured devcontainerdevelopment container: a portable, reproducible coding environment defined by a configuration file
Free GitHub account required
Walkthrough
Get Started
Open in GitHub Codespaces. The devcontainerdevelopment container: a portable, reproducible coding environment defined by a configuration file is pre-configured and starts automatically. When you push from Codespaces, GitHub forks the repository to your account automatically.
Prefer working locally? Clone the repo and open it in any editor that supports the Dev Containers specification (VS CodeVisual Studio Code, JetBrains, and others). The devcontainer config will be detected automatically.
Start Your Challenge
The sibling containers (flagd, Grafana LGTMLoki, Grafana, Tempo, Mimir, k6 loadgen) start automatically as part of the devcontainer compose. Wait ~2-3 minutes for them to be ready before moving on.
Explore the UIs
Open the Ports tab and navigate to each service:
- Port 8080: Spring Boot lab. Add ?userId=subject-42 for a stable fractional-rollout bucketing key.
- Port 3000: Grafana (admin / admin). Open Dashboards > Feature Flag Metrics (empty until metrics are wired). Try Explore > Tempo to see flag evaluations as span events.
- Port 9090: Prometheus. Query metrics directly via the Prometheus UI or curl http://localhost:9090/api/v1/query.
- Port 3200: Tempo. Tempo HTTP API used by the verify script to assert traces are flowing.
flagd runs on the docker-internal network only. No port forwarding needed.
Start the Lab
The sibling containers are already up. Boot the Spring Boot lab by clicking Run on
Laboratoryin the Spring Boot Dashboard panel (or press F5 withLaboratory.javaopen), or from the terminal:./mvnw spring-boot:runSpans start flowing into Tempo on the first request. The trace pipeline is already wired. The metrics pipeline is dead (task 4a), so the Grafana dashboard panels stay empty until you fix it.
Turn On the Metrics Exporter
OTel ships two parallel pipelines: traces (already flowing into Tempo) and metrics (dead). The OTel Java Agent attached to the lab JVMJava Virtual Machine has both pipelines plumbed and pointed at the LGTM stack, but
otel.properties(next topom.xml) setsotel.metrics.exporter=none, so anything the meter records goes nowhere.Open
otel.propertiesand flip the exporter on. While you're there, look at the export interval. The default makes the next steps harder than they need to be.Once the exporter is on,
MetricsHook(next step) finds the working meter provider throughGlobalOpenTelemetrywithout any further plumbing. You will need to restart the lab to pick up the change.Register MetricsHook
OpenFeatureConfig.javaregistersTracesHookbut stops there.MetricsHookneeds anOpenTelemetryhandle to find the meter provider. The agent installs one globally at JVM start, soGlobalOpenTelemetry.get()is the way to reach it.Register
MetricsHookalongsideTracesHookinOpenFeatureConfig. The Feature Flag Metrics dashboard stays empty until traffic drives through. That is what the loadgen step does.Write and Register ContextSpanHook
The two contrib hooks tell you what happened: which flag, which variant, which reason. What is missing is the why visible in Tempo. Write a
ContextSpanHookthat copies the merged eval context attributes onto the active OTel span asfeature_flag.context.<key>:before(hookCtx) { span = active OTel span for each allowlisted key in merged eval context: span.setAttribute("feature_flag.context." + key, value) }HookContext.getCtx()returns the merged evaluation context (global + transaction + invocation). Use a fixed allowlist ofList.of("species", "country", "dose"). Never iterate the whole context:targetingKeyjoins to PIIPersonally Identifiable Information in real apps, and span attributes are retained for days in Tempo at scale.Register
ContextSpanHookalongsideTracesHookandMetricsHookinOpenFeatureConfig. The verifier searches Tempo forfeature_flag.context.dose=underdoseonce you are done.Turn On the Loadgen
flags.jsonhas two flags:loadgen_active(off by default) and the misbehavingvision_amplifier_v2. flagd watches the file and picks up changes within about a second.Flip
loadgen_activeto on. The k6 loadgen polls it every two seconds and starts five virtual users hammering the lab. Within a minute, latency p99 should climb ~200ms and the 5xx rate ~10% on the dashboard, confirming that the bad arm ofvision_amplifier_v2is active.Roll Back the Rollout
The dashboard's variant-distribution panel shows which variant is the culprit. Roll it back by editing
flags.jsonto setvision_amplifier_v2to 100% off.No deploy. No rebuild. No restart of the lab.
Watch the dashboard: the 5xx rate falls back to baseline, and the next batch of subjects walks out seeing.
Complete Your Challenge
- When you push from Codespaces, GitHub forks the repository to your account automatically. If you are working locally, fork the repository on GitHub before pushing.
- Verify your solution:
If it passes, it generates a Certificate of Completion you can paste into the discussion../verify.sh - Share your solutions in the challenge thread on community.offon.dev.
Completed the challenge? Share your achievement on LinkedIn
Toolbox
- Java 21 (Temurin) - pre-installed in the devcontainer
- ./mvnw - Spring Boot Maven Wrapper, no global Maven install required
- curl - sends requests to http://localhost:8080/ to test the lab, and to Prometheus on http://localhost:9090/ to query metrics directly
- Grafana - browser UIUser Interface at http://localhost:3000 (admin/admin) for the Feature Flag Metrics dashboard and Tempo trace explorer
- jq - pretty-prints the JSON evaluation details