This walkthrough contains the full solution. Try solving the challenge yourself first, then come back if you get stuck or want to compare approaches.
Understanding the Setup
All files are in adventures/01-echoes-lost-in-orbit/expert/manifests. Three applications are deployed via an Argo CD ApplicationSet:
- hotrod/: The HotROD app, managed by an Argo Rollouts Rollout with a canary strategy and an AnalysisTemplate for health gating.
- otel/: The OpenTelemetry Collector, configured as a DaemonSet to receive traces from HotROD, convert them to metrics via the Spanmetrics connector, and export to Jaeger and Prometheus.
- traffic-generator/: A simple app that continuously sends requests to HotROD to generate observable traffic.
The OpenTelemetry Collector config has four main sections: receivers (where data enters), connectors (bridge between pipelines, e.g. Spanmetrics converts traces to metrics), exporters (where data is sent), and service pipelines (the wiring). Understanding this structure is key to Objective 2.
Automated Rollout Progression to HotROD 1.76.0
This objective depends on the other two. The rollout is currently aborted because the AnalysisTemplate has no data to evaluate, which in turn is because the OpenTelemetry Collector is not running.
Open Argo CD to see the current state of all three applications:
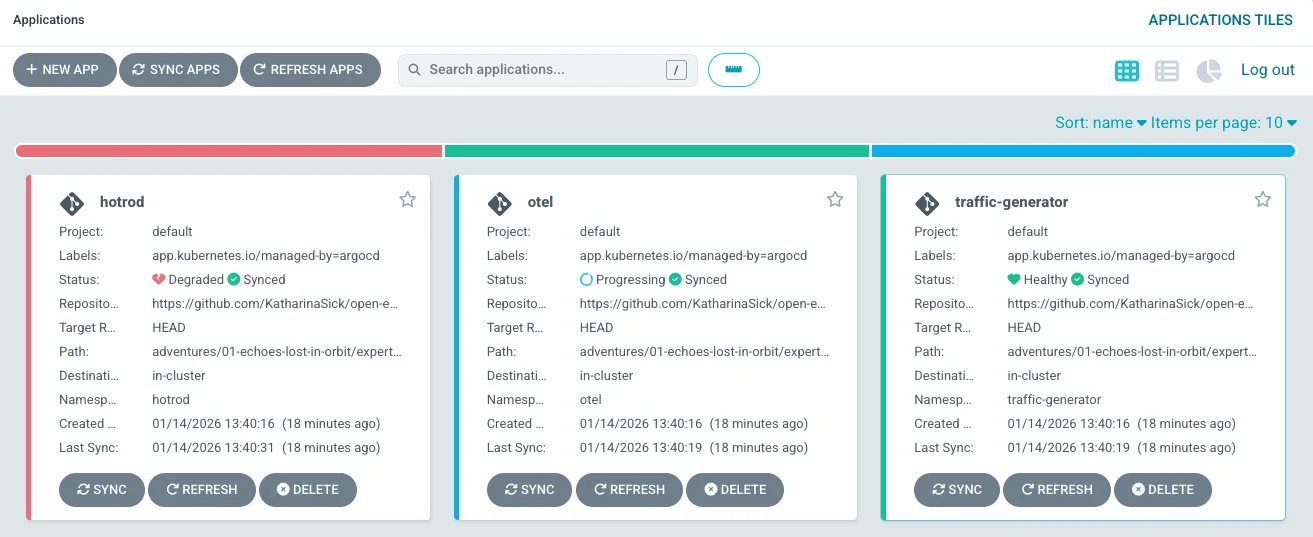
hotrod is degraded due to a failed AnalysisRun; otel keeps crashing; traffic-generator is healthy Fix Objectives 2 and 3 first. Once the collector is running and the AnalysisTemplate is complete, retry the rollout and it will progress automatically.
OpenTelemetry Collector Configured
The collector is crash-looping with "invalid configuration: no receiver configuration specified in config". Three things need to be added: an OTLP receiver, a metrics pipeline, and a Prometheus exporter.
Open
adventures/01-echoes-lost-in-orbit/expert/manifests/otel/config.yaml. The starting state looks like this:receivers: # empty connectors: spanmetrics: dimensions: - name: hotrod.namespace - name: hotrod.pod.name - name: hotrod.pod.hash exporters: debug: verbosity: detailed otlp: endpoint: jaeger-collector.jaeger.svc.cluster.local:4317 tls: insecure: true service: pipelines: traces: receivers: [otlp] exporters: [debug, otlp, spanmetrics]Fix 1: add the OTLP receiver. Check how HotROD exports traces by looking at the rollout environment variables:
env:
  - name: OTEL_EXPORTER_OTLP_ENDPOINT
    value: "http://collector.otel.svc.cluster.local:4318"
Port 4318 is OTLP/HTTP. Add a matching receiver:
receivers:
  otlp:
    protocols:
      http:
        endpoint: 0.0.0.0:4318
Fix 2: add a metrics pipeline. The Spanmetrics connector already exists and is wired into the traces pipeline as an exporter, which generates metrics. But those metrics need a pipeline to flow through. Add one pointing to the debug exporter as a first step:
service:
  pipelines:
    traces:
      receivers: [otlp]
      exporters: [debug, otlp, spanmetrics]
    metrics:
      receivers: [spanmetrics]
      exporters: [debug]
Fix 3: export metrics to Prometheus. The AnalysisTemplate will query Prometheus for the spanmetrics data, so a Prometheus exporter is required. Check
otel/daemonset.yamlfor the port that Prometheus is already configured to scrape:Info
Look for the port named
prometheusin the DaemonSet spec and theprometheus.io/portpod annotation. Both point to port8889.exporters: debug: verbosity: detailed otlp: endpoint: jaeger-collector.jaeger.svc.cluster.local:4317 tls: insecure: true prometheus: endpoint: "0.0.0.0:8889"Update the metrics pipeline to include the Prometheus exporter, then commit and push. After Argo CD syncs, restart the collector:
argocd app get otel --refresh kubectl rollout restart daemonset/collector -n otelThe collector is now healthy. Traces appear in Jaeger and metrics arrive in Prometheus:
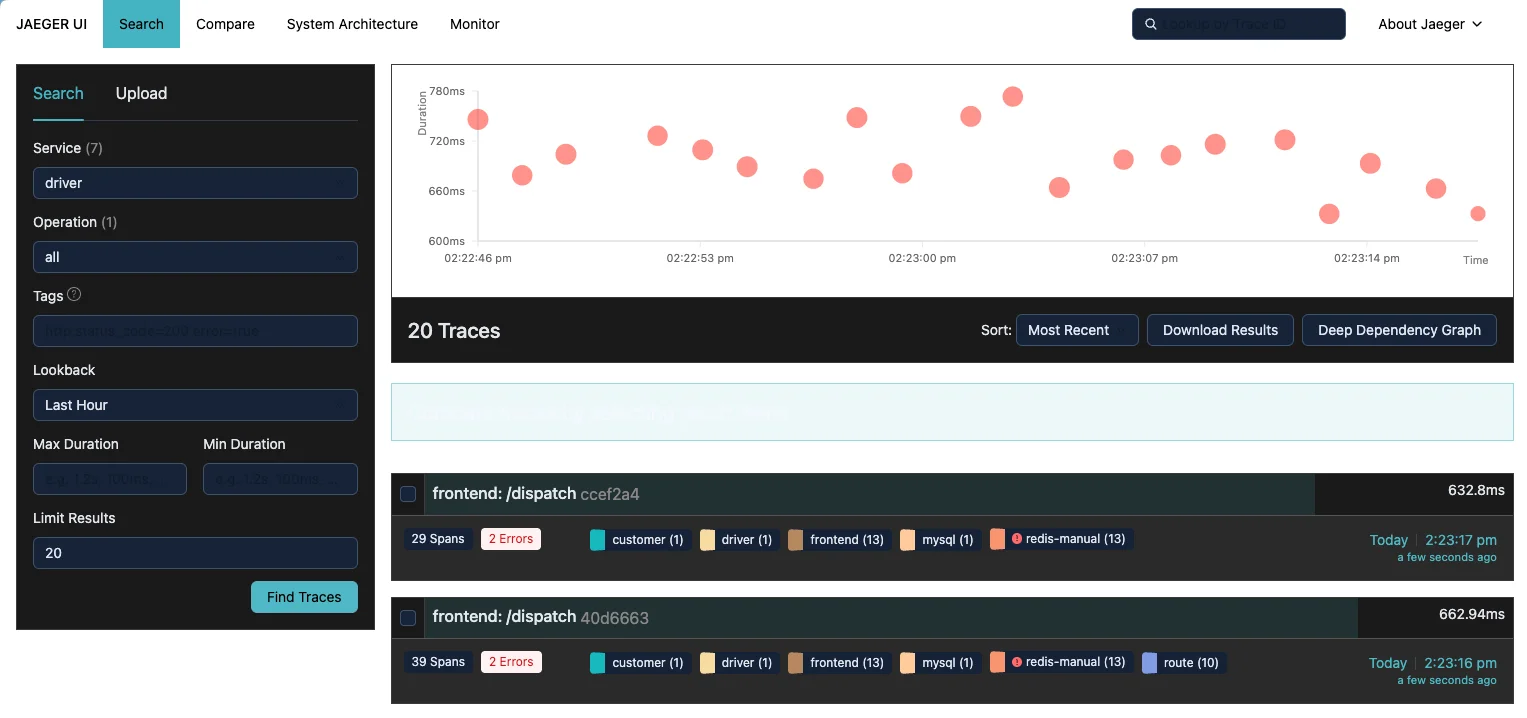
Traces from HotROD flowing through the collector into Jaeger 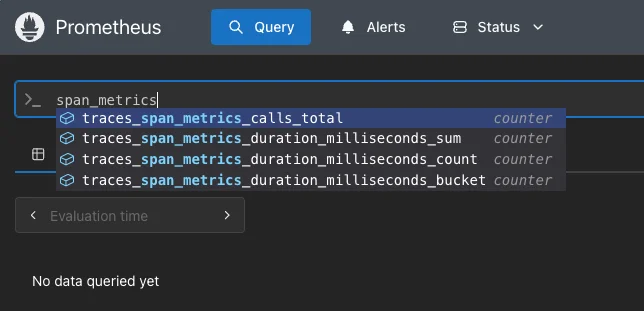
Span-derived metrics now queryable in Prometheus Key Takeaways
- The OpenTelemetry Collector requires at least one receiver in each pipeline, and every component referenced in a pipeline must be defined in its section.
- The Spanmetrics connector acts as both an exporter in the traces pipeline and a receiver in the metrics pipeline, bridging the two.
Canary Analysis with Three PromQL Queries
The AnalysisTemplate already has error-rate and latency metrics, but the latency metric was failing because Prometheus had no spanmetrics data yet. A third metric for traffic detection is missing entirely.
Open the Argo Rollouts dashboard and review the last AnalysisRun. The
error-rate-lt-5-percentcheck passed, butlatency-p95-lt-1serrored withslice index out of range: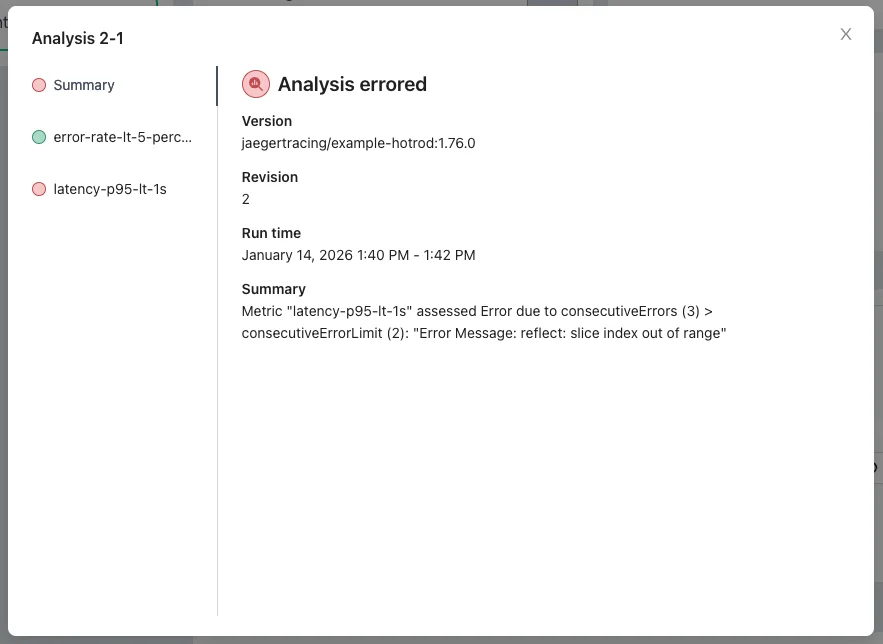
The latency metric errored because no spanmetrics data existed in Prometheus yet Now that the collector is running, the latency query will have data to evaluate. The query itself is correct and does not need to change.
Missing metric: traffic detection. Without a minimum traffic check, a canary could be promoted without ever receiving a real request. Add this metric first:
- name: traffic-detection initialDelay: 90s interval: 10s count: 5 successCondition: result[0] >= 0.05 failureLimit: 3 inconclusiveLimit: 5 consecutiveErrorLimit: 3 provider: prometheus: address: http://prometheus-server.prometheus.svc.cluster.local query: | sum(rate(hotrod_requests_total{ namespace="{{args.namespace}}", rollouts_pod_template_hash="{{args.canary-hash}}" }[2m]))Commit, push, refresh the Argo CD app, and retry the rollout:
argocd app get hotrod --refresh kubectl argo rollouts retry rollout hotrod -n hotrodThis time all three metrics pass and the rollout completes:
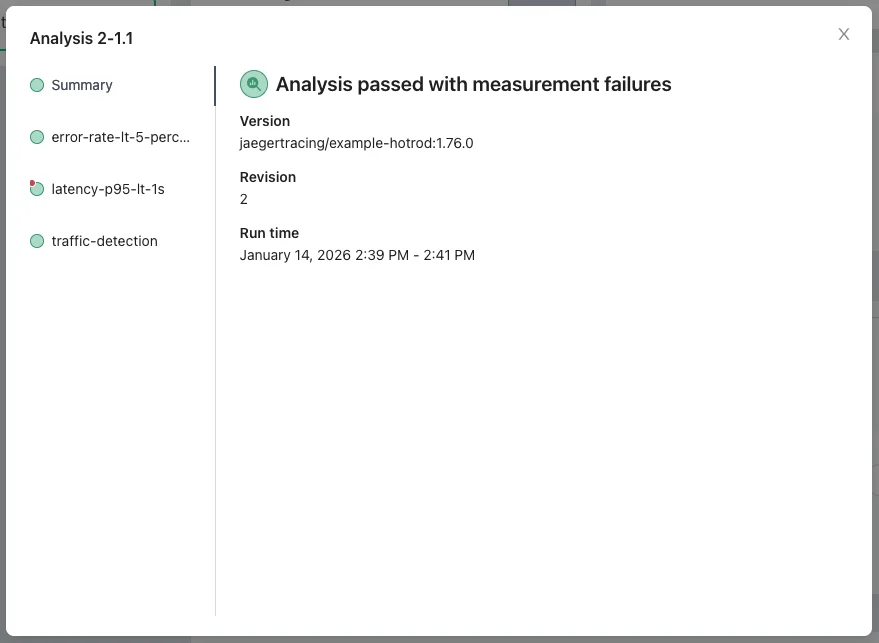
All three metrics pass, and the rollout advances to HotROD 1.76.0 The complete AnalysisTemplate with all three metrics:
apiVersion: argoproj.io/v1alpha1 kind: AnalysisTemplate metadata: name: hotrod-analysis spec: args: - name: namespace - name: canary-hash metrics: - name: traffic-detection initialDelay: 90s interval: 10s count: 5 successCondition: result[0] >= 0.05 failureLimit: 3 inconclusiveLimit: 5 consecutiveErrorLimit: 3 provider: prometheus: address: http://prometheus-server.prometheus.svc.cluster.local query: | sum(rate(hotrod_requests_total{ namespace="{{args.namespace}}", rollouts_pod_template_hash="{{args.canary-hash}}" }[2m])) - name: error-rate-lt-5-percent initialDelay: 60s interval: 10s count: 3 successCondition: result[0] < 0.05 failureLimit: 2 inconclusiveLimit: 3 consecutiveErrorLimit: 2 provider: prometheus: address: http://prometheus-server.prometheus.svc.cluster.local query: | sum(rate(hotrod_requests_total{ namespace="{{args.namespace}}", rollouts_pod_template_hash="{{args.canary-hash}}", error="true" }[2m])) / sum(rate(hotrod_requests_total{ namespace="{{args.namespace}}", rollouts_pod_template_hash="{{args.canary-hash}}" }[2m])) - name: latency-p95-lt-1s initialDelay: 90s interval: 10s count: 3 successCondition: result[0] < 1000 failureLimit: 2 inconclusiveLimit: 3 consecutiveErrorLimit: 2 provider: prometheus: address: http://prometheus-server.prometheus.svc.cluster.local query: | histogram_quantile(0.95, sum by (le) (rate(traces_span_metrics_duration_milliseconds_bucket{ hotrod_namespace="{{args.namespace}}", hotrod_pod_hash="{{args.canary-hash}}" }[2m])) )Key Takeaways
- A traffic detection gate prevents idle canaries from being promoted without having handled real traffic.
- Argo Rollouts AnalysisTemplates can use trace-derived metrics from Spanmetrics as promotion gates, giving you observability-driven progressive delivery.
Final Result
Complete OpenTelemetry Collector Config
Final Result
Complete OpenTelemetry Collector ConfigOTLP/HTTP receiver added, metrics pipeline wired from Spanmetrics to Prometheus, Prometheus exporter configured on port 8889.
apiVersion: v1
kind: ConfigMap
metadata:
name: collector-config
labels:
app: collector
data:
collector-config.yaml: |
receivers:
otlp:
protocols:
http:
endpoint: 0.0.0.0:4318
connectors:
spanmetrics:
dimensions:
- name: hotrod.namespace
- name: hotrod.pod.name
- name: hotrod.pod.hash
exporters:
  debug:
    verbosity: detailed
  otlp:
    endpoint: jaeger-collector.jaeger.svc.cluster.local:4317
    tls:
      insecure: true
  prometheus:
    endpoint: "0.0.0.0:8889"
extensions:
health_check:
endpoint: 0.0.0.0:13133
service:
extensions: [health_check]
pipelines:
traces:
receivers: [otlp]
exporters: [debug, otlp, spanmetrics]
metrics:
receivers: [spanmetrics]
exporters: [debug, prometheus]The Hyperspace Lane Is Open
The collector is receiving traces, converting them to metrics, and feeding them to Prometheus. The canary proved itself under real traffic before earning promotion. HotROD 1.76.0 is running in production, guided every step of the way by observability signals.
The routes between star systems are open again. See how other crews navigated the hyperspace configuration.