This walkthrough contains the full solution. Try solving the challenge yourself first, then come back if you get stuck or want to compare approaches.
Understanding the Setup
All files are in adventures/01-echoes-lost-in-orbit/intermediate/manifests. The structure looks like this:
- appset.yaml: An Argo CD ApplicationSet that generates Applications for staging and prod using the Git directory generator.
- base/: The base Kustomize configuration for the echo-server app, containing the AnalysisTemplate, Rollout, Service, and kustomization.yaml.
- overlays/: Environment-specific overlays that adjust replica counts for staging and prod.
Info
All steps in this guide use the staging environment. Since staging and production are identical except for replica count, the same fixes apply to both. We'll only mention staging throughout.
Pod Info Version 6.9.3 Deployed
The rollout already targets image 6.9.3, but the stable replica set is still running 6.8.0. Something is blocking progression.
Check which version is running and why the rollout is stuck:
kubectl -n echo-staging get rollout echo-server -o yamlThe
spec.template.spec.containers[0].imagefield showsstefanprodan/podinfo:6.9.3as desired. But scrolling down tostatus.conditionsreveals an error:- message: 'Rollout aborted update to revision 2: Metric "container-restarts" assessed Error due to consecutiveErrors (1) > consecutiveErrorLimit (0): "Error Message: Post "http://prom-server.prometheus.svc.cluster.local/api/v1/query": dial tcp: lookup prom-server.prometheus.svc.cluster.local on 10.96.0.10:53: no such host"' reason: RolloutAborted status: "False" type: ProgressingTo confirm what is actually serving traffic, look up the
status.stableRShash and inspect that replica set directly:# status.stableRS: 6fdd67656d kubectl -n echo-staging get replicaset echo-server-6fdd67656d -o yamlspec: template: spec: containers: - name: echo-server image: stefanprodan/podinfo:6.8.0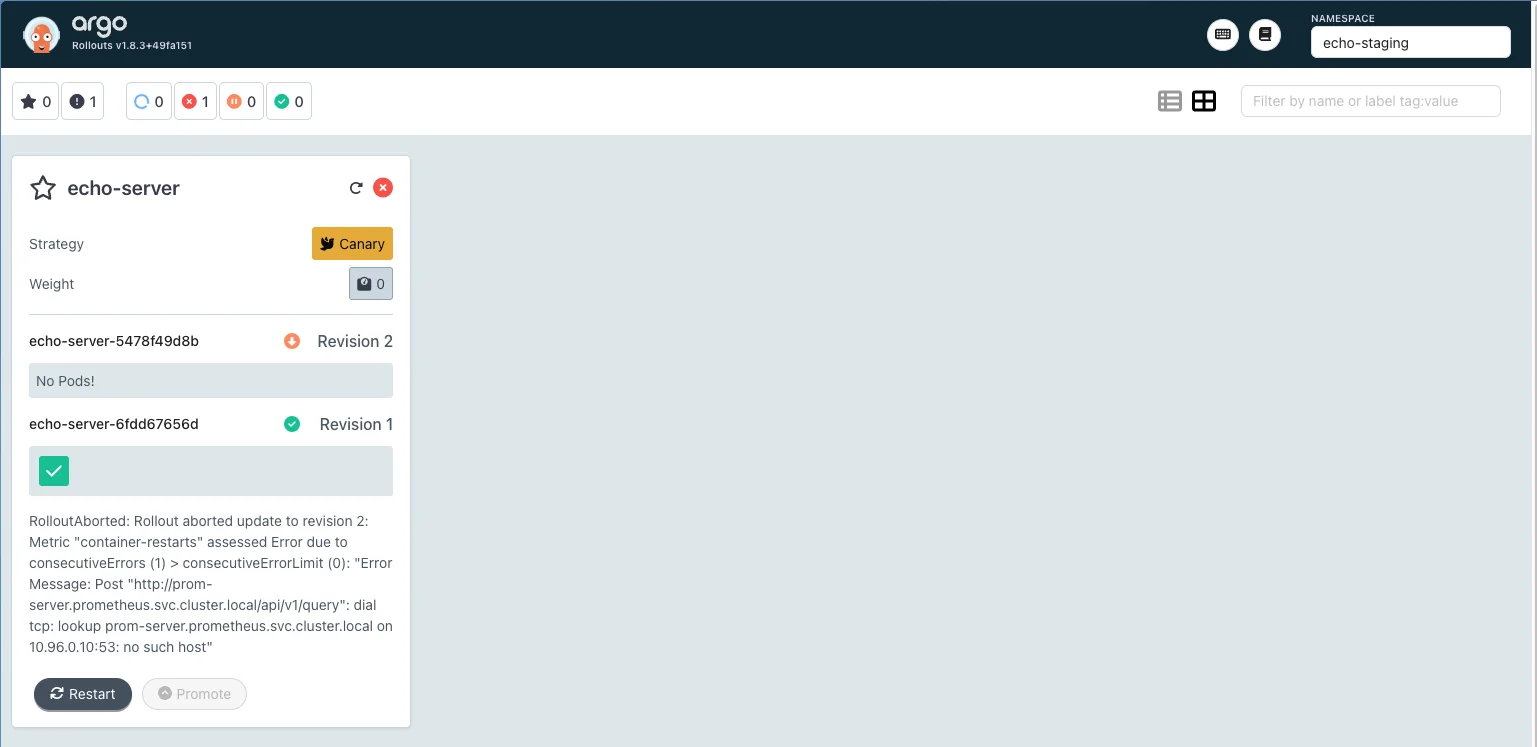
The Argo Rollouts UI confirms the rollout is aborted The rollout aborted due to an error in the AnalysisTemplate. Fixing the analysis is what will unblock the version upgrade. Move on to the next objective to investigate.
Key Takeaways
- Argo Rollouts won't progress a rollout if there are errors in the configuration.
- Check rollout status conditions first when a rollout appears stuck.
Automatic Canary Progression Based on Health Metrics
The rollout is aborted because the AnalysisTemplate is referencing a Prometheus service that does not exist. There are also two bugs in the metric definitions themselves.
Inspect the AnalysisTemplate directly:
kubectl -n echo-staging get analysistemplate echo-analysis -o yamlOr open the file at
adventures/01-echoes-lost-in-orbit/intermediate/manifests/base/analysis-template.yaml. You will find two metrics:container-restartsandready-containers.Bug 1: wrong Prometheus service name. The error says it cannot reach
prom-server.prometheus.svc.cluster.local. Let's check if this service exists. The URL follows the structurehttp://<service-name>.<namespace>.svc.cluster.local, so we run:kubectl -n prometheus get serviceThis outputs one service called
prometheus-server, notprom-server. There's a typo in the manifest. Fix the address incontainer-restarts:address: http://prometheus-server.prometheus.svc.cluster.localCommit, push, then retry the rollout:
kubectl argo rollouts retry rollout echo-server -n echo-staging
kubectl argo rollouts -n echo-staging status echo-server
A new error appears:
Degraded - RolloutAborted: Rollout aborted update to revision 2: Metric "container-restarts" assessed Failed due to failed (1) > failureLimit (0)Bug 2: inverted success condition. The
container-restartsquery returns 0 when there are no restarts, which is the healthy state. But the current conditionresult[0] > 0only passes when restarts exist. Invert it:successCondition: result[0] == 0Commit, push, and retry again. Open the Argo Rollouts UI, select the
echo-stagingnamespace, and click the rollout card. You will see multiple AnalysisRuns accumulate as each retry creates a new one: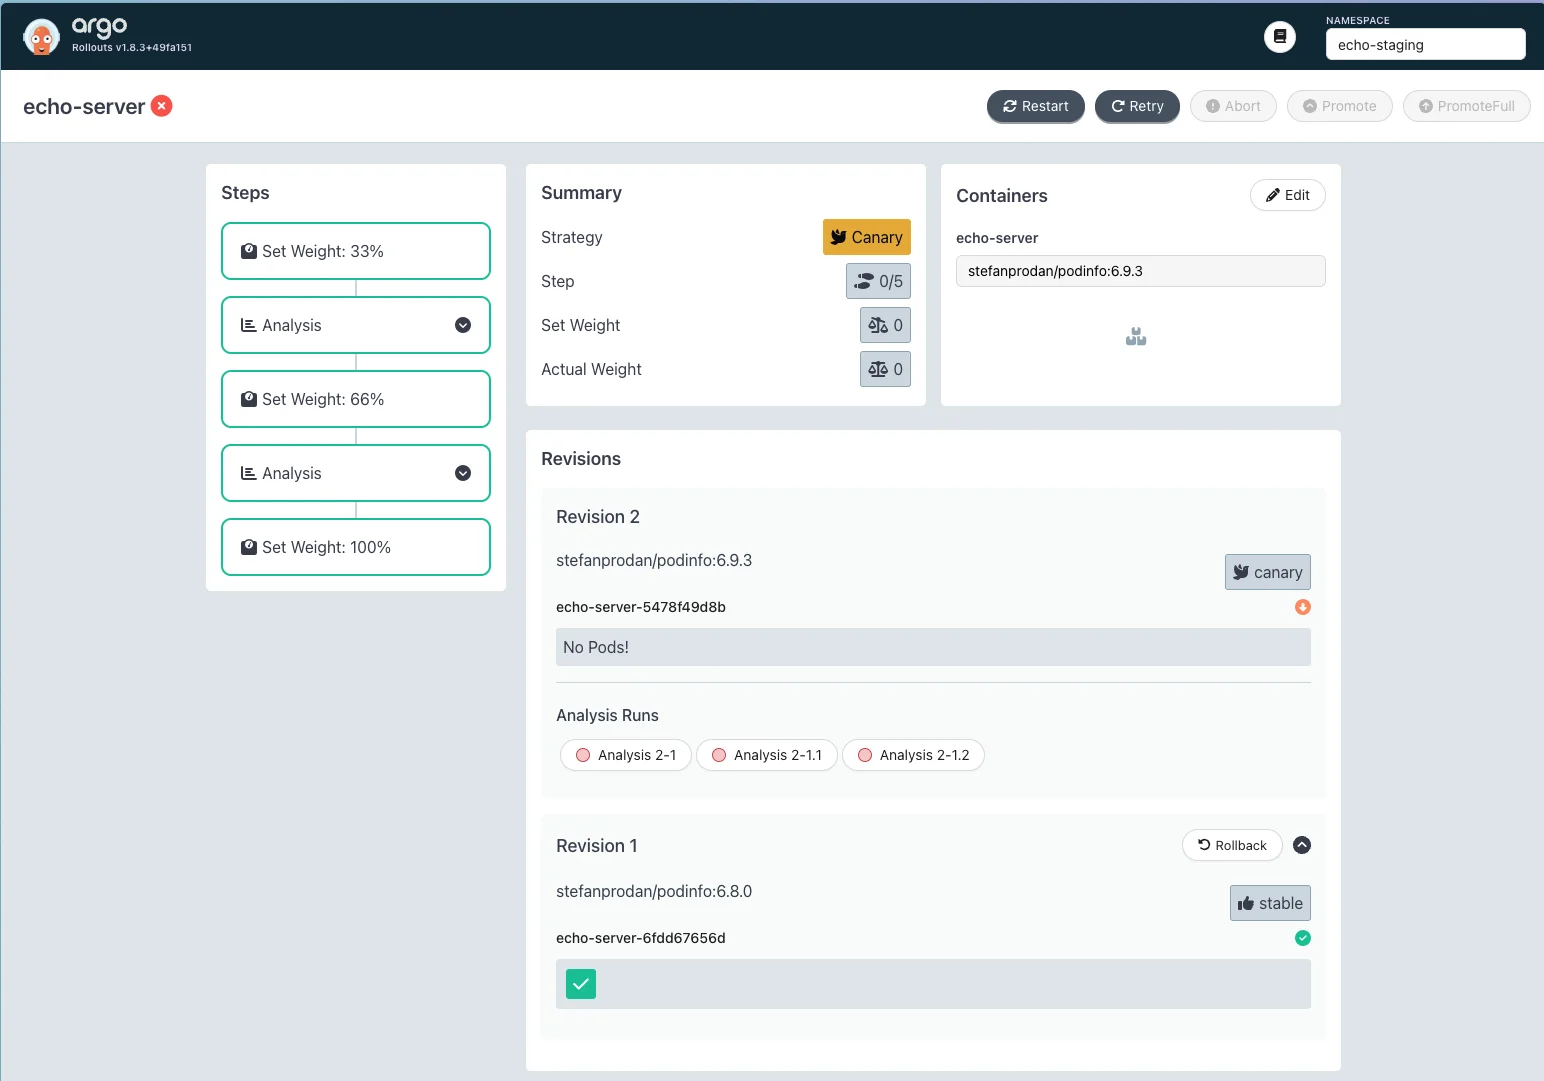
Each retry creates a new AnalysisRun; earlier ones show the previous errors Click the latest AnalysisRun. The
container-restartsmetric is now passing, butready-containersis failing: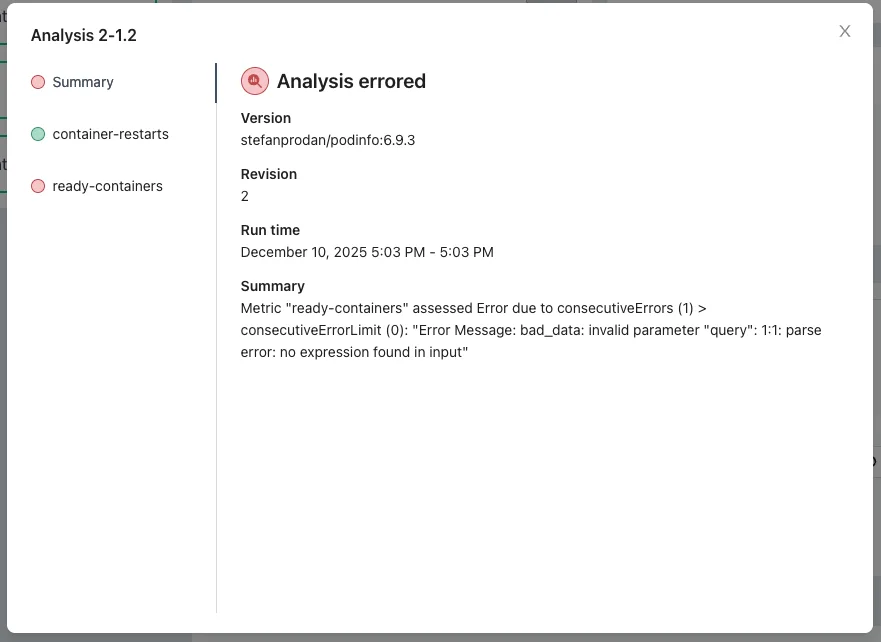
Clicking the
ready-containersmetric on the left reveals the query body is empty: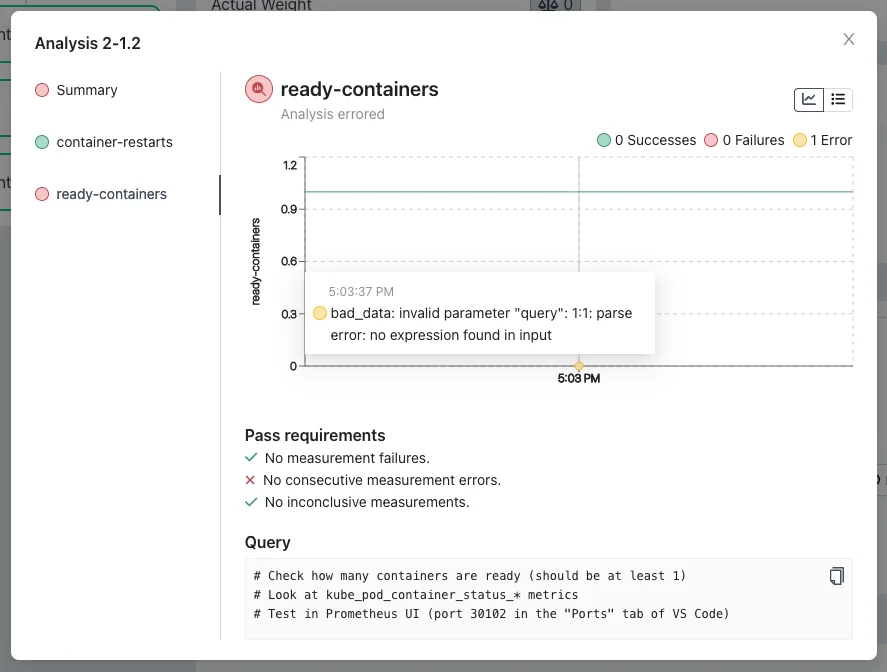
Bug 3: missing query implementation. The
ready-containersmetric has no query. Open the Prometheus UI (port 30102 in VS Code's Ports tab) and explore metrics beginning withkube_pod_container_status_. Choosekube_pod_container_status_ready: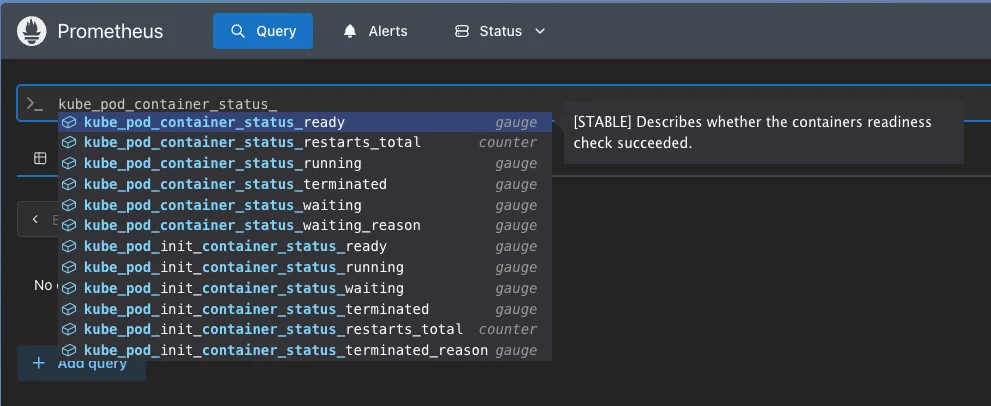
Filter to your namespace and pods, then run:
kube_pod_container_status_ready{
  namespace="echo-staging",
  pod=~"echo-server-.*"
}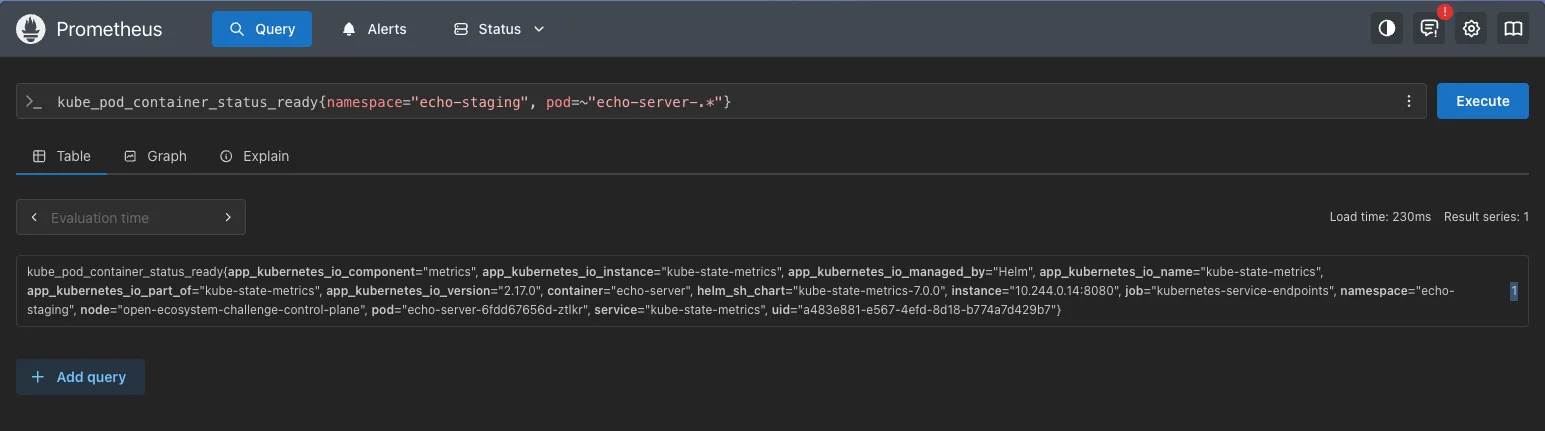
This returns a list. Wrap it in
sum()to get a single count:sum( kube_pod_container_status_ready{ namespace="echo-staging", pod=~"echo-server-.*" } )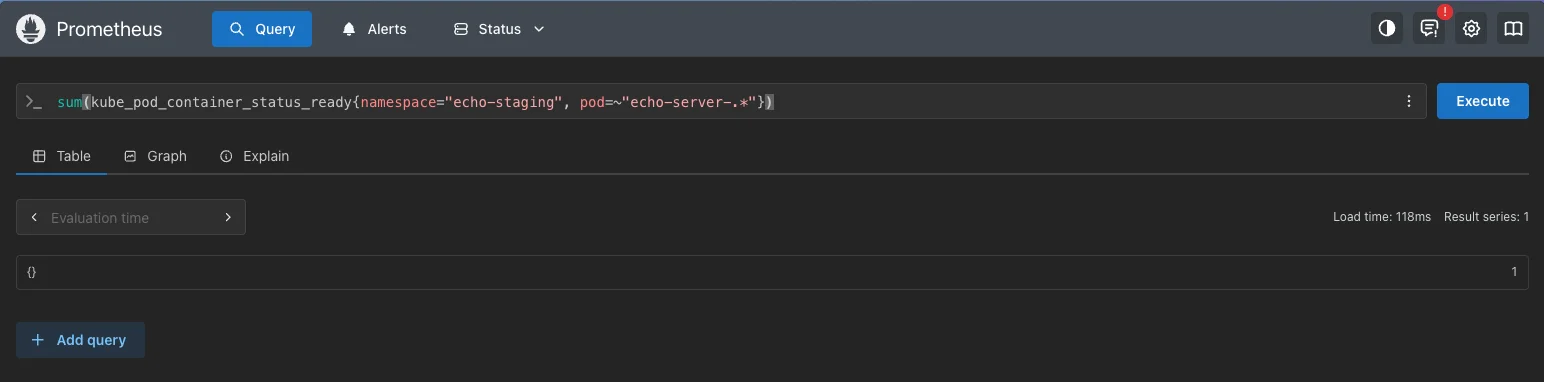
The aggregated query returns 1, which satisfies successCondition: result[0] >= 1 Replace the hardcoded namespace with
{{args.namespace}}so it works for both environments, and addor vector(0)as a fallback for when no data exists yet:query: |- sum(kube_pod_container_status_ready{ namespace="{{args.namespace}}", pod=~"echo-server-.*" }) or vector(0)Commit, push, and retry once more. This time the rollout progresses through all canary stages and completes successfully.
Key Takeaways
- There are multiple effective ways to debug Argo Rollouts. Try them and use your favorite.
- Service references follow the format service-name.namespace.svc.cluster.local. A typo here causes a silent DNS lookup failure at runtime.
- Prometheus queries are a simple and effective way to validate application health during rollouts.
- The Prometheus UI is a great way to test and build your queries before adding them to an AnalysisTemplate.
Two Working PromQL Queries in the AnalysisTemplate
This objective is resolved by the previous step. Both metrics are now implemented and validated.
With the fixes in place, the AnalysisTemplate contains two working health checks:
- container-restarts: confirms zero container restarts during the rollout window.
- ready-containers: confirms at least one container is ready before the rollout progresses.
All Rollouts Complete Successfully
Once both metrics pass, Argo Rollouts advances through the canary stages automatically and marks the rollout complete in both staging and production.
Apply the same analysis-template fix in the production overlay if needed, or let Argo CD sync it automatically. Both environments will complete the rollout to podinfo 6.9.3 without manual intervention.
Tip
Run the smoke test to confirm all objectives are met:
adventures/01-echoes-lost-in-orbit/intermediate/smoke-test.sh
Final Result
Complete AnalysisTemplate
Final Result
Complete AnalysisTemplateAll three fixes applied: correct Prometheus address, corrected success condition, and implemented ready-containers query.
apiVersion: argoproj.io/v1alpha1
kind: AnalysisTemplate
metadata:
  name: echo-analysis
spec:
  args:
    - name: namespace
  metrics:
    - name: container-restarts
      successCondition: result[0] == 0
      failureLimit: 0
      inconclusiveLimit: 0
      consecutiveErrorLimit: 0
      count: 1
      provider:
        prometheus:
          address: http://prometheus-server.prometheus.svc.cluster.local
          query: |
            # There should be no restarts
            sum(increase(kube_pod_container_status_restarts_total{
              namespace="{{args.namespace}}",
              pod=~"echo-server-.*"
            }[1m])) or vector(0)
    - name: ready-containers
      successCondition: result[0] >= 1
      failureLimit: 0
      inconclusiveLimit: 0
      consecutiveErrorLimit: 0
      count: 1
      provider:
        prometheus:
          address: http://prometheus-server.prometheus.svc.cluster.local
          query: |-
            # Check how many containers are ready (should be at least 1)
            sum(kube_pod_container_status_ready{
              namespace="{{args.namespace}}",
              pod=~"echo-server-.*"
            }) or vector(0)
The Canary Sings
The deployment pipeline is no longer silent. Both environments advanced to podinfo 6.9.3 guided by health checks that now actually check health. The Zephyrian relay network is back online, and the canary has earned its promotion.
Every crew navigates a broken deployment differently. See how others got their rollouts unstuck.